What Is Acid Rain?
Acid deposition, commonly known as acid rain, is a broad term that includes both wet deposition and dry deposition of acidic components. Wet deposition, in this case, represents any form of precipitation (e.g. rain, snow, fog or hail) mixed with acidic components, such as sulfuric or nitric acid, that falls to the ground from the atmosphere. Dry deposition represents the settling of these acidic components out of the atmosphere in the absence of precipitation. Rain has a natural pH of about 5.6; it is slightly acidic because carbon dioxide (CO2) dissolves into it forming carbonic acid, a weaker acid than the components driving acid rain. Nevertheless, there are strong acidic components in the natural environment, such as hydrogen sulfide and sulfur dioxide from volcanic eruptions, dimethyl sulfide from the ocean and nitrogen oxides from lightning. These chemical compounds can naturally lower the pH of rainwater to 5.0. Therefore, "acid rain" is often defined as rainwater with a pH less than 5.0, implying some impact from human activities.
SO2 and NOX are the main precursors of acid rain. SO2 mainly originates from burning of fossil fuels to generate electricity. NOx pollution is emitted by vehicles as well as industrial sources such as power plants, industrial boilers, cement kilns, and turbines. SO2 and NOx react with water, oxygen and other chemicals to form sulfuric and nitric acid, and lower the pH to form acid rain.
Acid rain impacts the environment both directly and indirectly. For instance, as sulfate deposits to the ground via precipitation, the calcium and magnesium ions in the soil are leached out. This large amount of mineral loss in soil also affects tree growth, where in the worst cases, the plants wither and can even die due to lack nutrients.
Wildlife are also impacted by acid rain as it deposits on lakes and rivers, where sulfuric acid prevents fish from absorbing essential oxygen, salt and nutrients in the water. In addition, acid rain ionizes elemental aluminum, which is then mobilized and flows into the water, posing a lethal threat to the fish.
Acid rain also directly impacts our manmade environment by eroding buildings and statues, while suspended acidic particles can reach even less exposed, but particularly vulnerable items inside of buildings such as centuries-old literature and ancient artworks.
Air Pollution Control Policy and Acid Rain
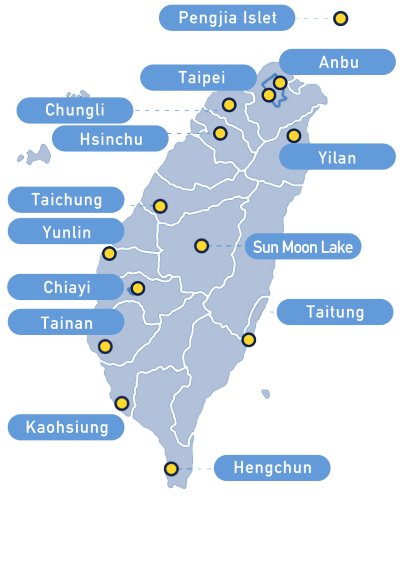
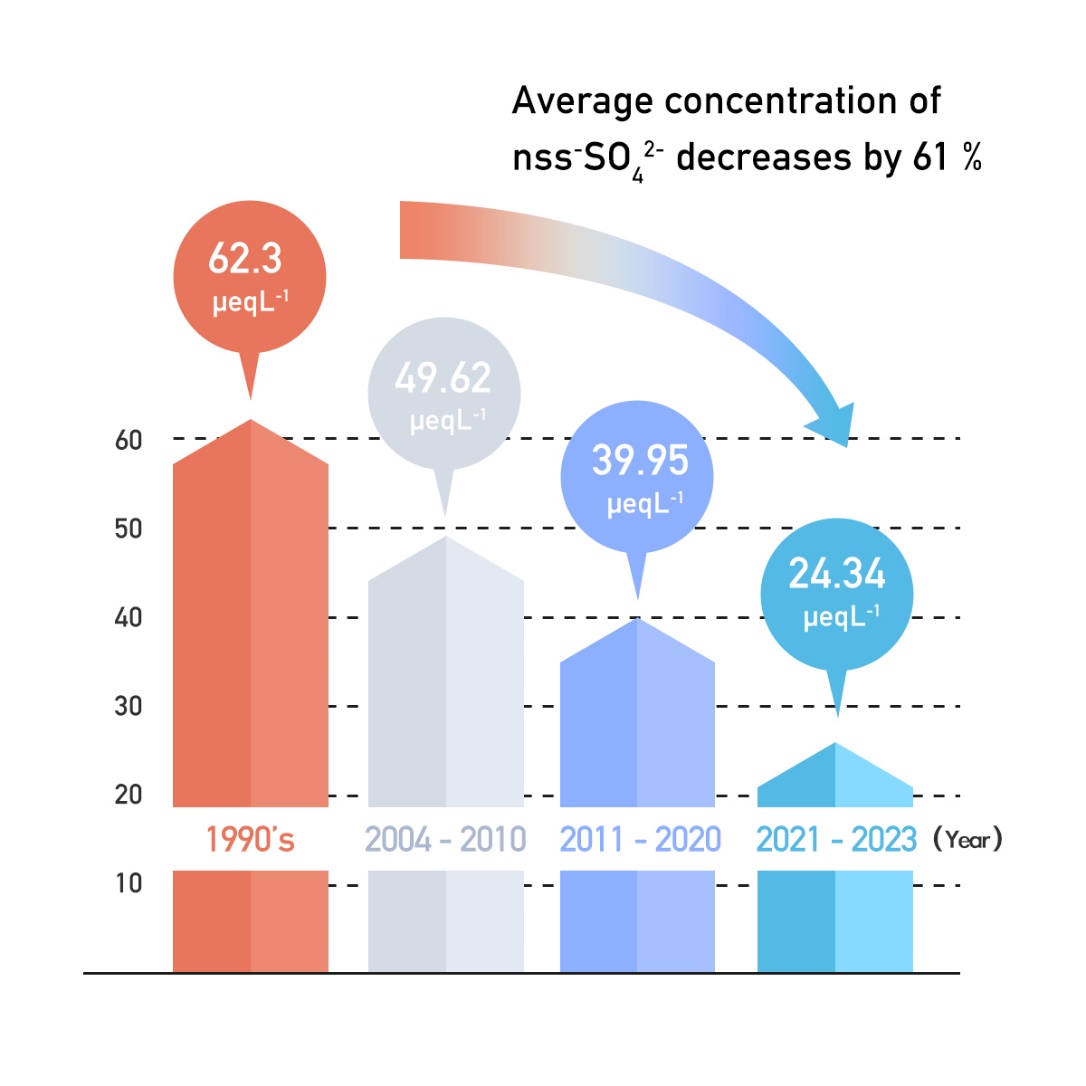
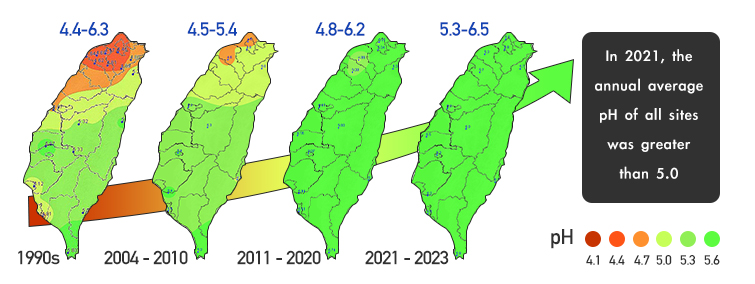
In the past 30 years, Taiwan Ministry of Environment (MOENV) has adopted various air pollution control strategies, and the acid rain situation has progressively improved. In 1992, MOENV established the air pollutants emission standards for stationary pollution sources and began levying air pollution fees in 1995. MOENV then implemented a permit management system, a continuous emission monitoring system, and announced more rigorous emission standards. As a result, large pollution sources gradually installed or improved pollution control equipment to reduce emissions. In terms of mobile pollution sources, MOENV also reduces the air pollution emitted from vehicles through measures such as oil composition control, more rigorous emission standards, regular inspections, subsidies for the replacement of old vehicles, etc. Thus far, MOENV has established 14 acid rain monitoring sites around Taiwan (see Figure 2), which observed a decrease in the average concentration of non-sea-salt sulfate ions (nss-SO42-) by 57% in the past 34 years. This in turn has been driving the rainwater pH upward, where in 2021-2024, the annual average pH value of all stations was greater than 5.0, proving the effectiveness of the adopted pollution control strategies.


The improvement of rainwater pH required (and still requires) the participation of all people, such as through regular inspections of automobiles and motorcycles, taking more public transportation, and developing energy-saving habits, which all reduce air pollution emissions and decrease the likelihood of acid rain.
Acid Rain in various countries
According to the monitoring results from the Acid Deposition Monitoring Network in East Asia (EANET) and the European Monitoring and Evaluation Programme (EMEP), rainwater pH has increased to over 5.0 in most of countries. The average pH value of rainwater in Taiwan was 5.75 in 2022.
*Data source:The Acid Deposition Monitoring Network in East Asia (EANET)、European Monitoring and Evaluation Programme (EMEP)、 National Atmospheric Deposition Program (NADP) and Ministry of Environment, Executive Yuan, R.O.C(Taiwan).