In order to improve air quality and investigate air pollutant emissions across Taiwan, the EPA established a national air pollutant emissions inventory in 1992, the “Taiwan Emissions Data System (TEDS)”. The scope of TEDS covers the estimation of emissions from various regions of the country (22 counties/cities in total), and from various sources and industries which are classified as follows:
- (1) point sources, such as factories, public and private places;
- (2) area sources, including commercial activities, daily living activities, construction activities, agricultural activities, non-road sources (such as trains, ships, airplanes and agricultural/construction machines etc.) and non-human activities (such as river dust, coastal dust, hillside dust, forest fires, etc.);
- (3) line (or road) sources, such as passenger cars, buses, trucks, scooters, etc.;
- (4) biological sources (VOC emissions from photosynthesis in forests).for a more detailed classification, can refer to figure 1.
The TEDS is updated every two years, based on a general review of estimation methodology and calculation of a new base year, and is partially updated for historical years. The latest version of TEDS is TEDS 12.0 with the base year of 2021. Excluding the biological sources, the 2021 national emissions in total are 300,641 MT for TSP (area, point, and line sources account for 90.9%,6.5% and 2.7% respectively), 50,174MT for SOx (point, area and line sources account for 90.6%, 9.3% and 0.2% respectively),240,581MT for NOx (point, line and area sources account for 44.3%,41.6% and14.1% respectively),372,868MT for VOCs (area, line and point sources account for 57.3%, 23.4% and 19.4% respectively) , can refer to figure 2.
TEDS12.0 version emission spatial distribution results PM is concentrated in urban areas and industrial areas, SOX is concentrated in industrial areas and ports, NOX is concentrated in highways, airports, ports, and industrial areas, and VOC is concentrated in urban areas and factories in many cities, can refer to figure 3.
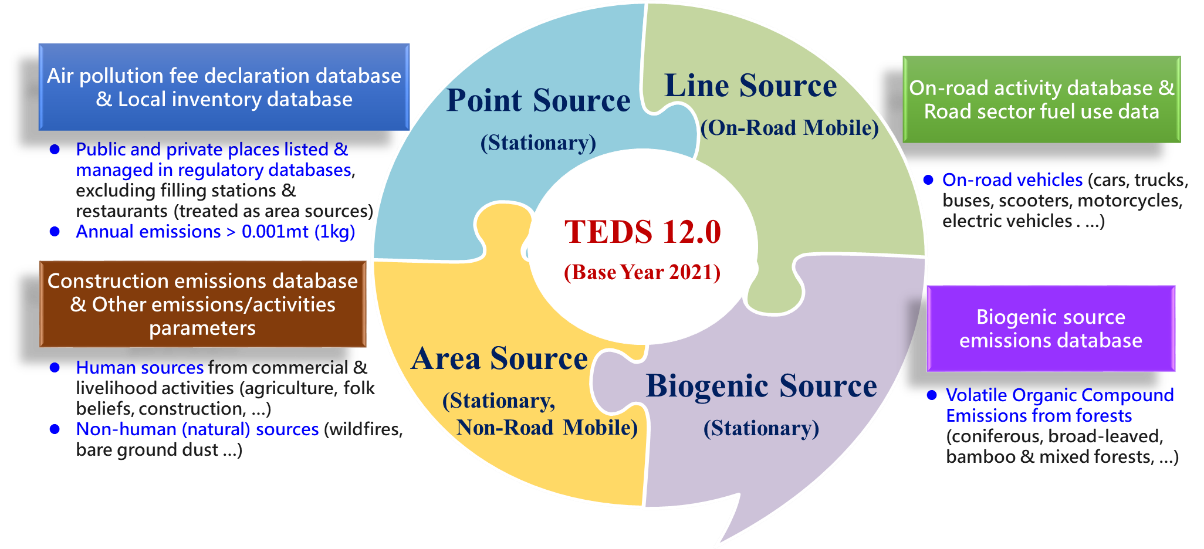 he main propose of TEDS 12.0 is to estimate the emissions of certain air pollutants in Taiwan ( 2021 base year ). The main catagory of sources include point source, line source, area source and biogenic source.
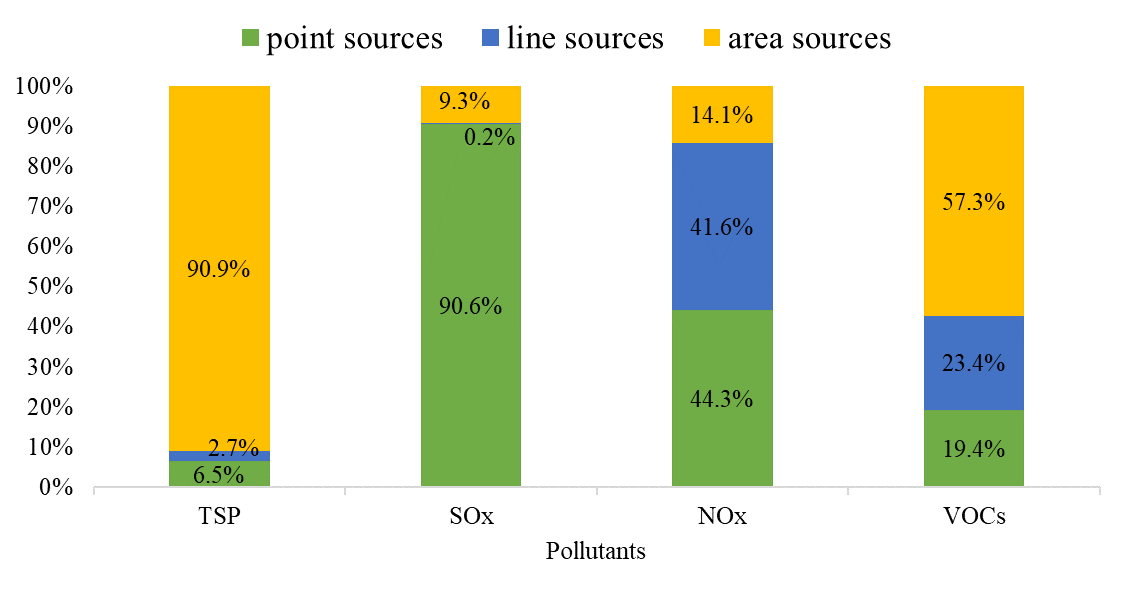 The proportion of sources in certain air pollutants in TEDS 12.0 ( not include biogenic sources ) includes TSP, SOx, NOx, NMHC ( VOC ).
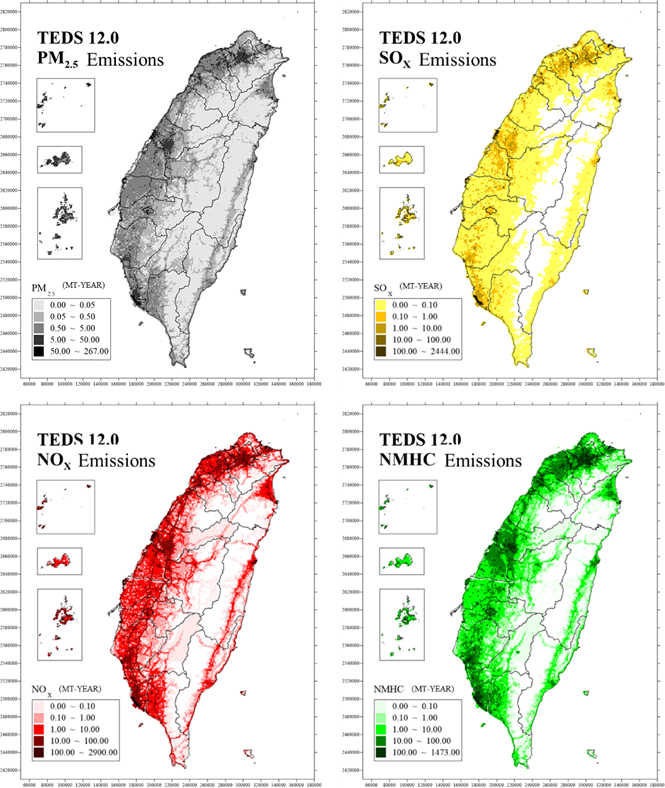 TEDS 12.0 emissions inventory maps are shown that air pollution is mainly distributed in urban and industrial area.